01 / The starting pointA new domain in a crowded niche
Lantern Path Books is a small Australian children's book publisher. We built the site from a blank domain at the end of May 2026. It had no links pointing at it, no mailing list and no search history of any kind. Children's books are a search space owned by the big publishers and the big retailers, so nobody was going to find a new imprint by accident.
The goal was simple to say and slow to do: get parents, grandparents and teachers to arrive on their own, from search, and keep arriving after we stopped pushing.
02 / What we builtGive people a reason to search for you
- Free things people actually look for. A bedtime routine checklist, a spelling worksheet generator and an educators' lounge of classroom resources. A book is hard to search for until you know its name. A worksheet generator is not.
- One page, one job. Every resource has its own page that answers a single question, so a search engine can tell exactly what it is for.
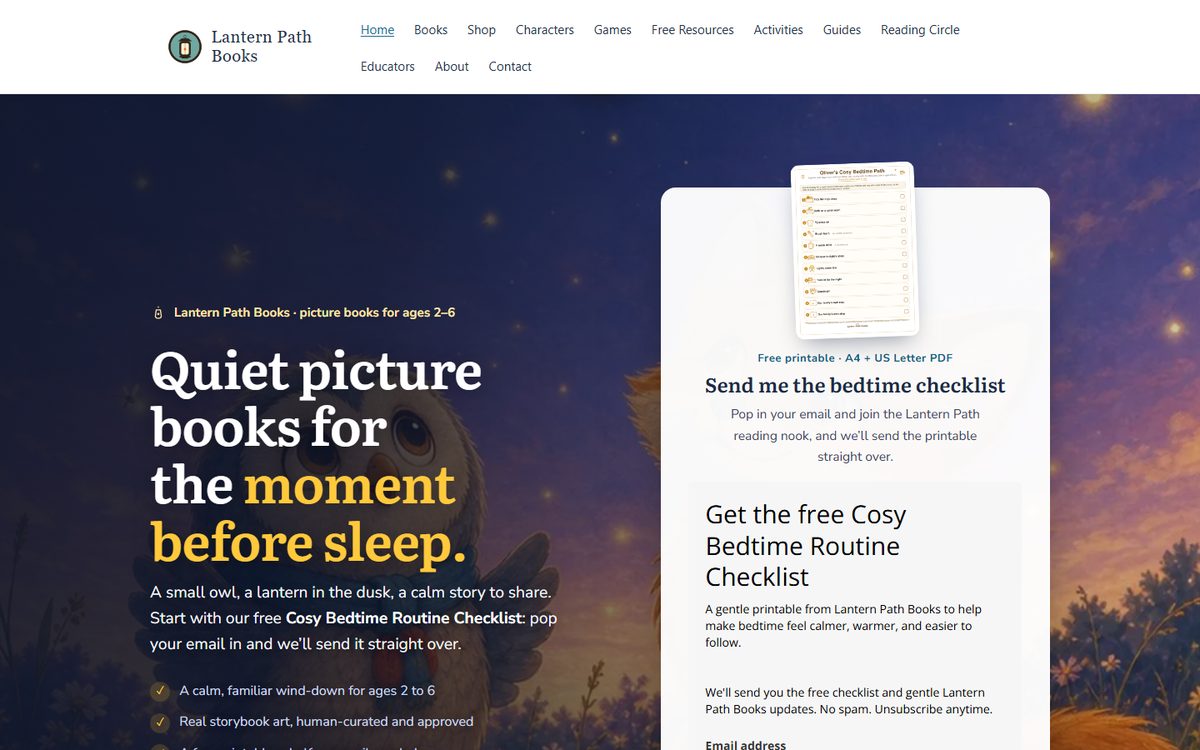
- Two versions of the main landing page. The bedtime checklist page was built twice, as an A and a B version, so traffic from Pinterest could be split between them and the stronger page kept.
- Fast, plain code. A static site with no page builder and no plugin stack, so it loads quickly on a phone over a weak connection.
03 / The resultsSearch grew every single month
Over the first four months the site recorded about 4,240 real visits from people in 27 countries. The interesting part is where they came from, and how that changed.
In June, search engines sent about 20 visits. In September they sent about 210, roughly ten times as many,. Search traffic also spread out: Bing and ChatGPT both began sending visitors in the later months, alongside Google.
04 / Reading the curve honestlyA spike is not the same as growth
July was the biggest month by a long way, and most of that came from Pinterest: about 1,030 visits landed on the two versions of the bedtime checklist page. By August that wave had passed.
Search did the opposite. It was the smallest source in June and the one that kept climbing after the spike faded. That is the whole lesson of this study: social and paid traffic stop when you stop. Search keeps compounding. It is the shape we build for, because it is the one that is still paying you in six months.
One more quiet signal: an Australian home education site, hea.edu.au, links to the free resources and has sent visitors every month since July. That is what a genuinely useful page earns.
05 / What this study does not showVisits, not sales
This study measures visitors. Book sales happen on outside stores that are not connected to this analytics, so we do not quote a sales figure here, and we will not estimate one.
06 / The same plan for a local businessWhat we would do for you
- Find the questions your customers type before they need you, and give each one a page that answers it properly.
- Build one free, useful thing people search for: a price guide, a checklist, a calculator.
- Keep the site fast and plain, so search engines keep sending people instead of slowing them down.
- Measure real people every month, and report where they came from, not just how many.